
You can now see live billing data in your overviews! It seems like a small thing, but required quite a lot of work behind the scenes.
Our previous system built on Prometheus and OpenCost took 30+ seconds to calculate costs for larger projects. Sometimes it timed out entirely. But the performance wasn't even the biggest problem - without accurate, real-time billing, we couldn't:
- Build trust - Developers need to see exactly what they're paying for, before they pay for it
- Enable self-service - No budget controls means no open signups
- Ship critical features - Usage caps, spending alerts, and cost analytics all depend on reliable billing data
From Prometheus Queries to Real-Time Events
The old architecture had a fundamental problem: every billing calculation required reconstructing history from Prometheus metrics. Want to know this month's costs? That's thousands of point-in-time queries, aggregations, and calculations. The math was right, but the performance wasn't sustainable.
We switched to streaming Kubernetes Events directly. Every pod creation, deletion, or resource change gets captured as it happens and stored in Postgres. No more reconstructing history - we have the complete timeline already indexed and ready to query.
The architectural differences are significant:
With Prometheus:
- Point-in-time metrics requiring complex reconstruction
- Heavy query load for billing calculations
- No native concept of state transitions
- Thousands of queries to calculate one project's costs
With Kubernetes Events + Postgres:
- Complete audit trail of every state change
- Simple SQL queries for cost calculations
- Real-time updates as events stream in
- Natural handling of edge cases (crashes, restarts, scaling)
The metering controller watches the Kubernetes API, transforms events into billing records, and stores them in Postgres. When you load your billing page, we're running a handful of indexed queries, not thousands of metrics calculations. This gives you per-second billing precision, but more importantly, pages that load in under a second instead of timing out.
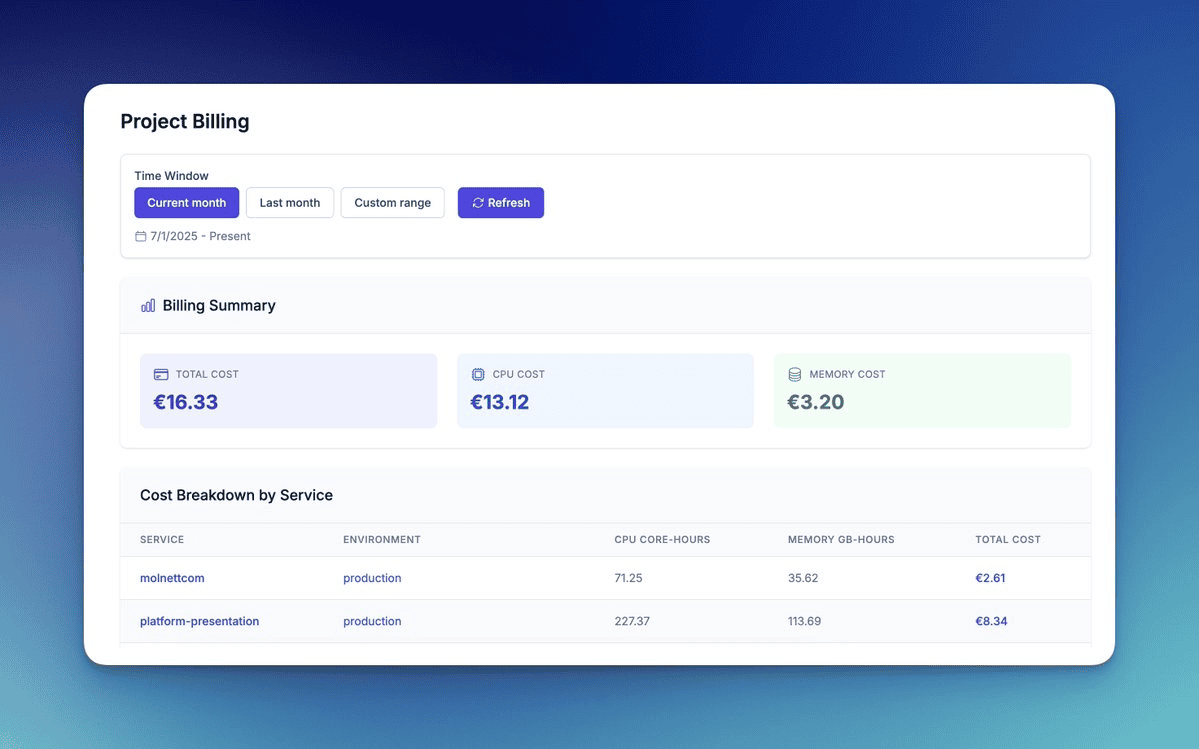
Your costs now appear in three places:
- Current month spend directly on your project dashboard
- Service-by-service breakdown for each environment
- Complete cost history you can export and analyze
Dashboard Redesign: Finding What You Need
The new dashboard solves two specific workflows that were painful before:
Understanding Current State
You land on your project and environments dashboards and immediately see:
- This month's spend (updated in real-time)
- Which environments and services are consuming the most resources
- The status of your services and deployments
No more clicking through multiple pages to understand your current infrastructure state. Everything's visible at every level.
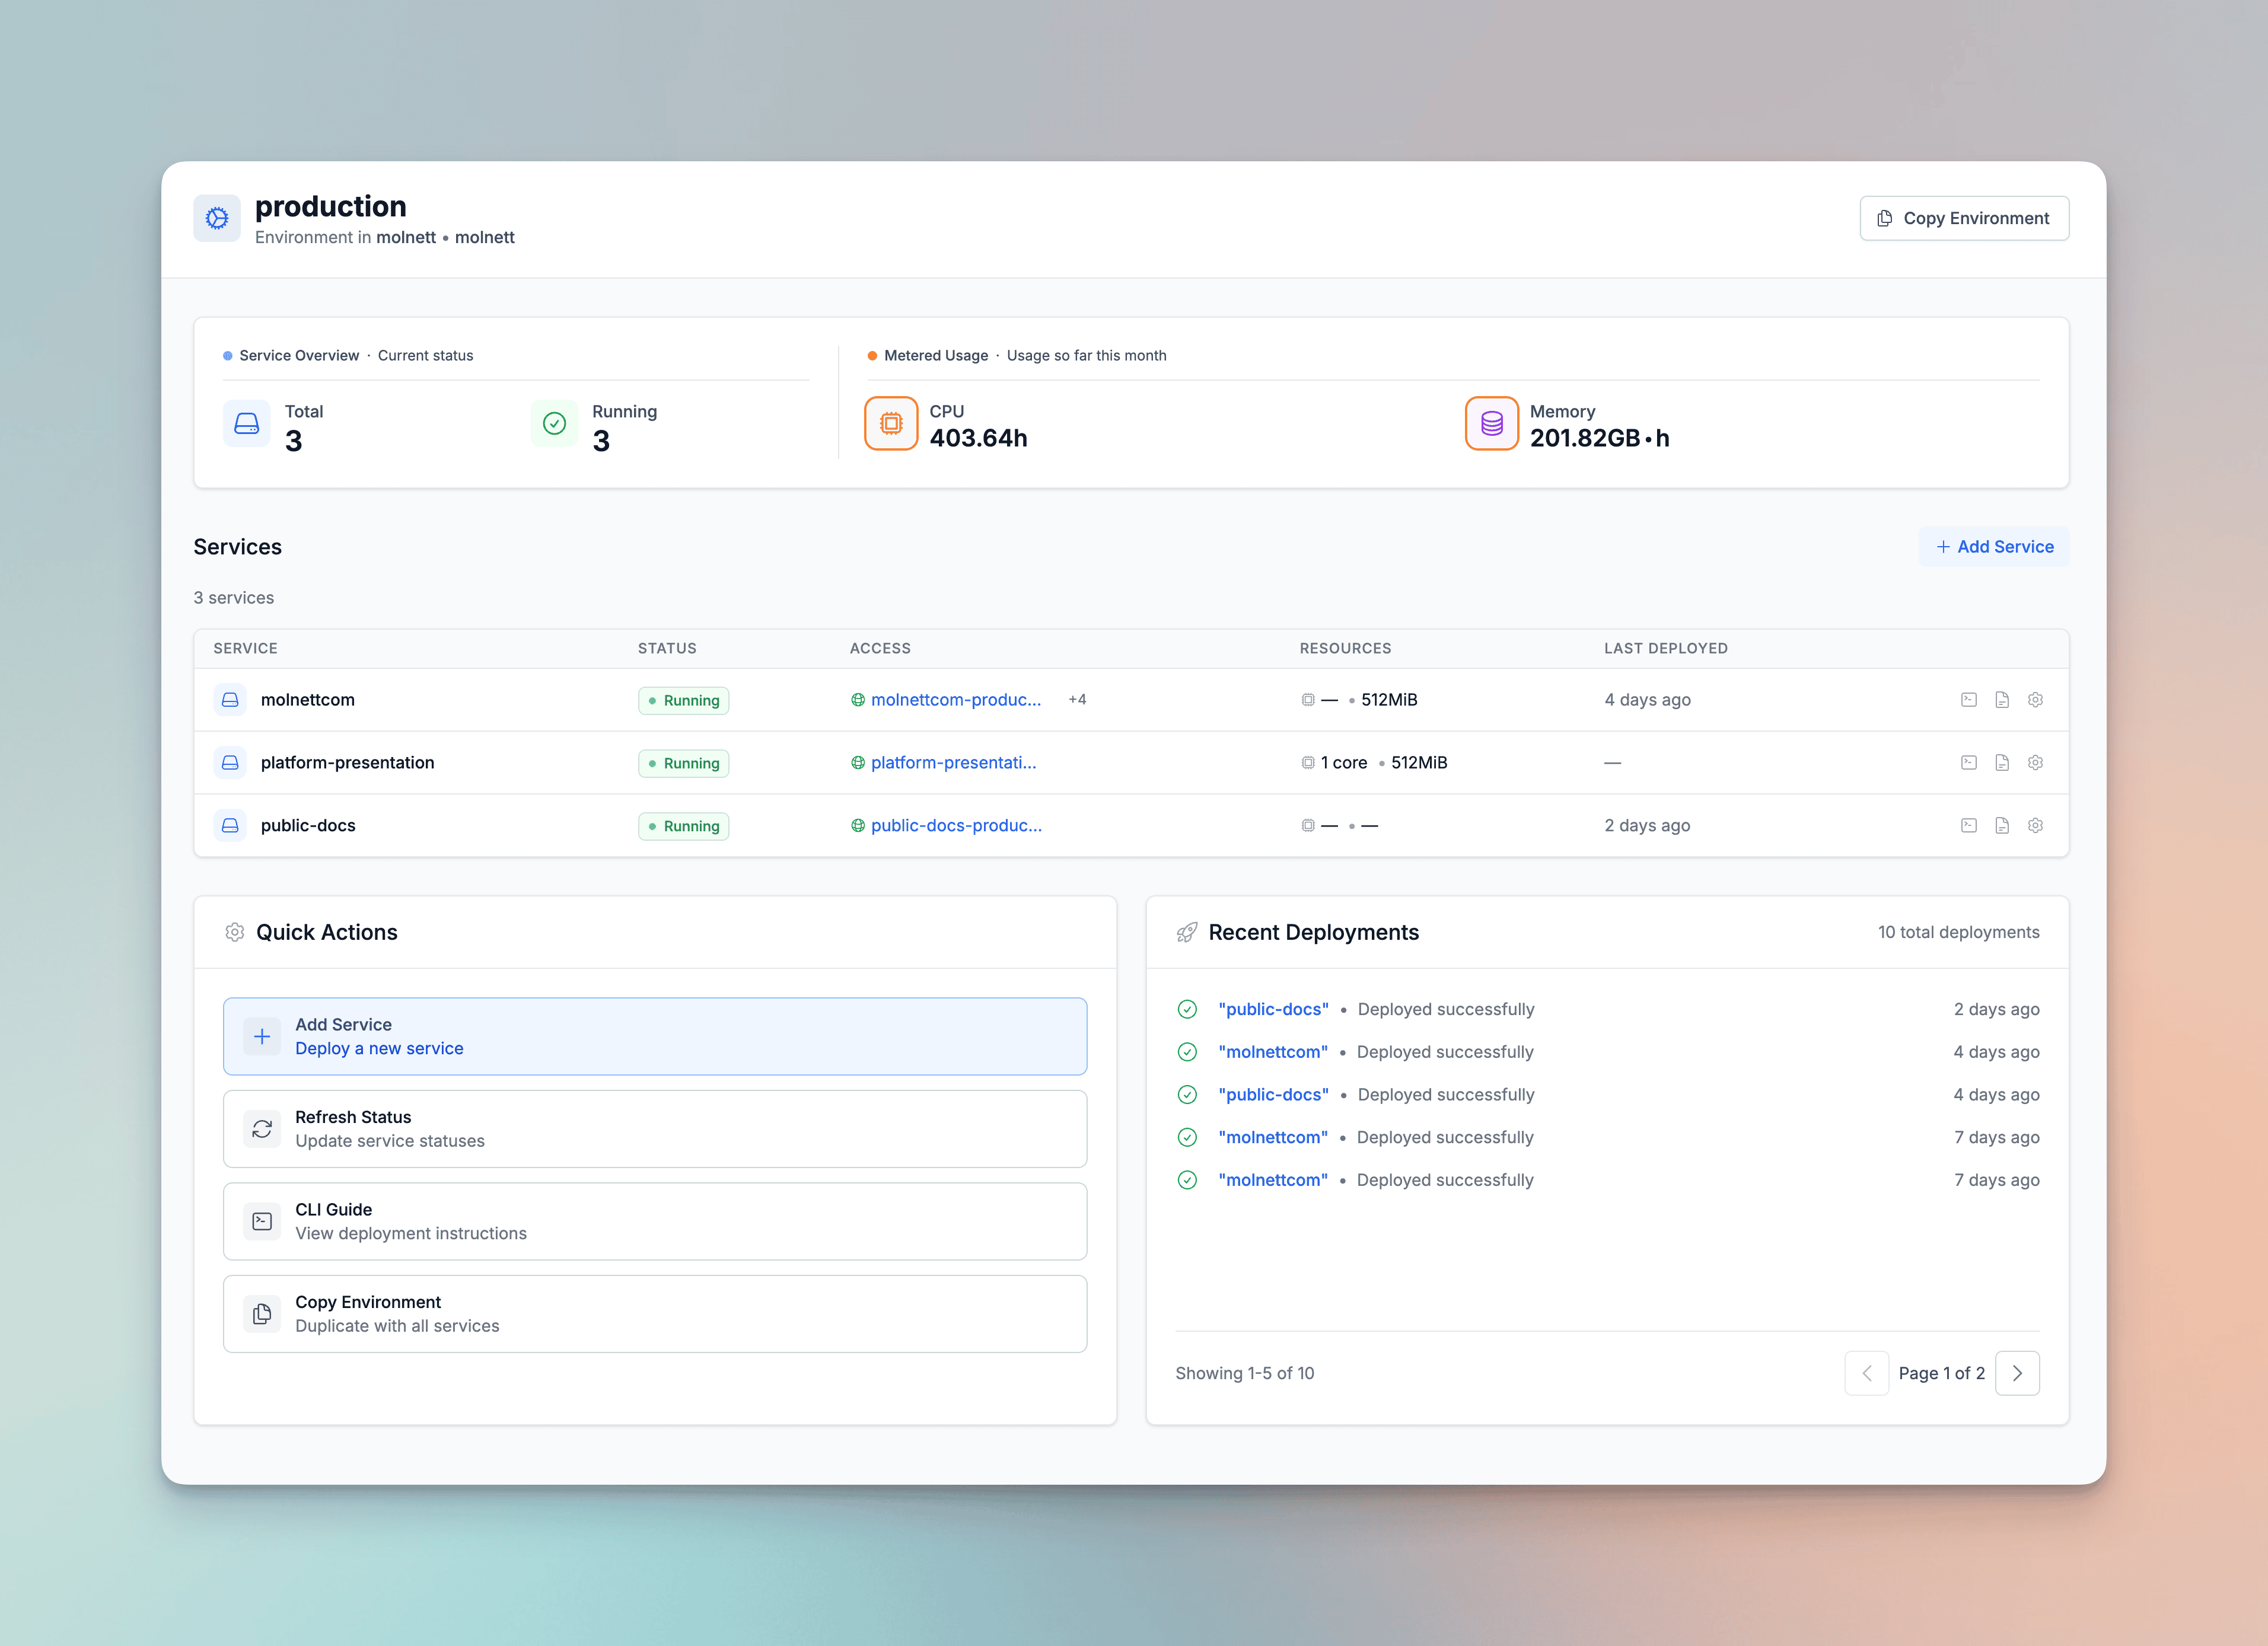
Tracking What Changed
The activity feed shows your team's recent actions:
- Who deployed what, when
- Resource limit changes
- New services added or removed
- Environment modifications
This matters when debugging cost spikes. You can correlate "costs jumped at yesterday" with "oh, that's when we scaled up the API service."
Building Towards Open Access
These aren't just incremental improvements - they're foundational changes that bring us closer to our goal of opening Molnett to everyone.
With accurate billing, we can now build:
- Budget controls that prevent surprise overages
- Usage caps for predictable spending
- Cost forecasting based on actual usage patterns
With better dashboards, teams can:
- Self-diagnose cost spikes without support tickets
- Track spending across environments in real-time
- Make informed decisions about resource allocation
Each piece - from event streaming to UI improvements - removes a barrier to self-service. We're building the infrastructure platform we wished existed: transparent, predictable, and accessible.
Want to be part of this journey?